Financial Information 2022-23
This information and the charts below are designed to explain the College’s financial position for the year 01 August 2022 to 31 July 2023 to readers unfamiliar with formal accounts and reports.
The monetary values have been taken from the published and audited Financial Statements and are presented in a format to provide useful information to students and stakeholders.
The College’s Results for the year 01 August 2022 to 31 July 2023

Income
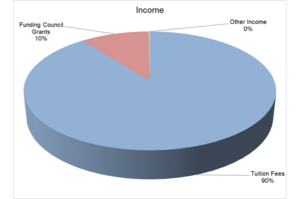
The College recorded income of £1.89m in the year ended 31 July 2023. Tuition fees make up the highest proportion of income received at 89.5%. 10.3% of income was received in funding grants for the purpose of supporting part time learners, access and widening participation. The remaining 0.2% includes income from Student Association activities, and other fees.
| Income | £ | % |
| Tuition Fees | 1,689,026 | 89.5% |
| Funding Council Grants | 193,761 | 10.3% |
| Other Income | 3,964 | 0.2% |
| Total | 1,886,751 | 100% |
Expenditure
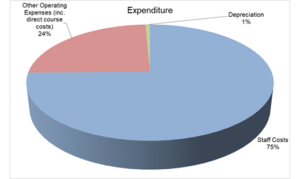
The College recorded spend of £2.73m split between: Staff costs, other operating expenses, which includes direct course costs and depreciation. 74.8% of this spend was incurred on staffing costs, which includes direct staff costs, apprenticeship levy contributions and employer tax, national insurance and pension contributions.
| Expenditure | £ | % |
| Staff Costs | 2,041,003 | 74.8% |
| Other Operating Expenses (inc. direct course costs) | 668,843 | 24.5% |
| Depreciation | 19,768 | 0.7% |
| Total | 2,729,614 | 100% |
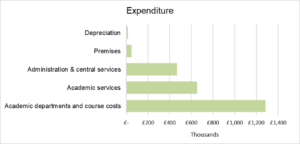
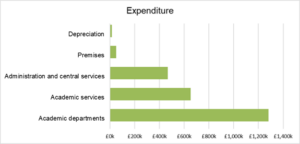
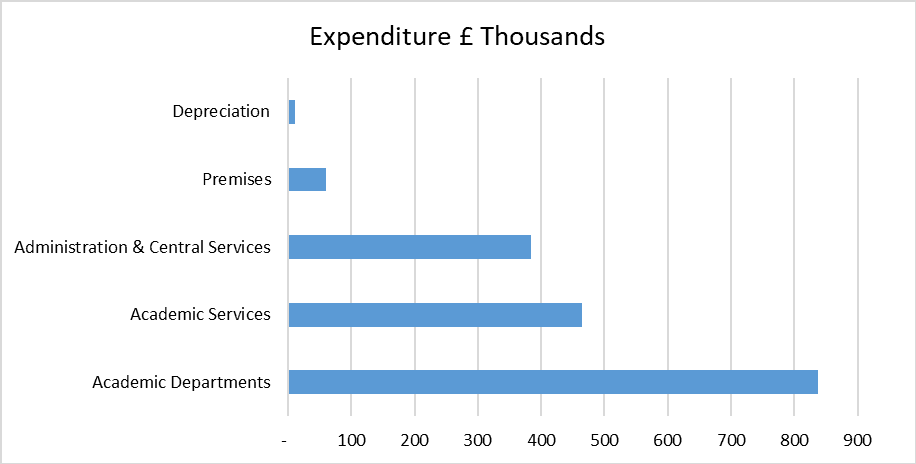
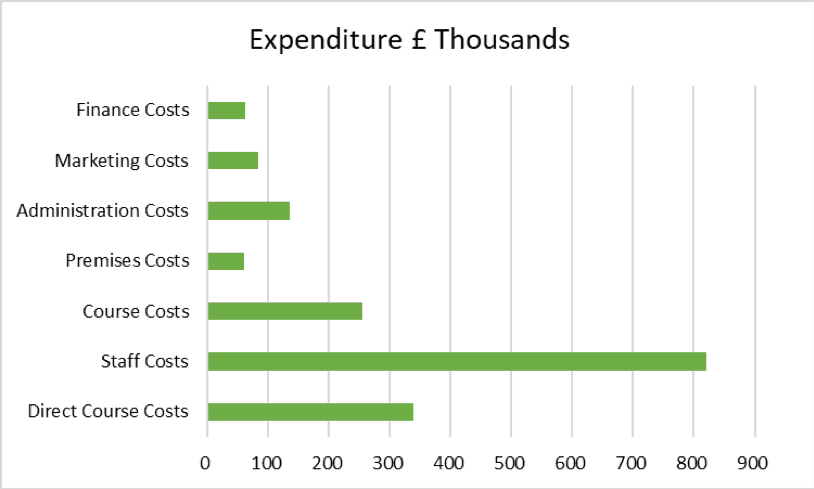
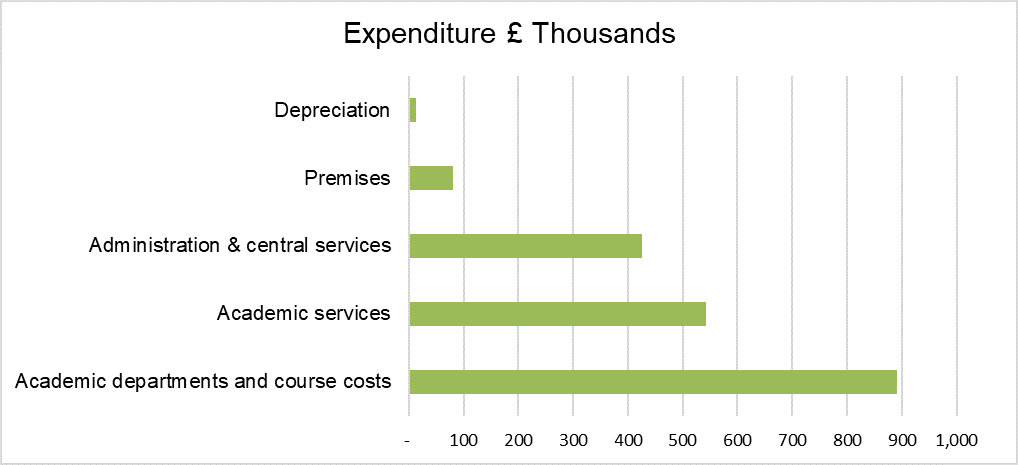
The same £2.73m spend can be shown in different formats to better understand how the College manages its spending. The College regularly reviews its spending and future budget to enable it to make decisions and achieve the best value for students.
-
Financial Information 2017-18
This information and the charts below are designed to explain the College’s financial position for the year 01 August 2017 to 31 July 2018 to readers unfamiliar with formal accounts and reports.
The money values have been taken from the published and audited Financial Statements and are presented in a format to provide useful information to students and stakeholders.
The College’s Results for the year 01 August 2017 to 31 July 2018
Total Income £1.78m
Less
Total Expenditure £1.76m
=
Surplus
£0.02m
Income
The College received income of £1.78m in the year ended 31 July 2018. Tuition fees are by far the highest proportion at 88% of income. 11% of income was received in Funding Council grants for the purpose of access and widening participation. 1% other includes income from OCASA activities, transfer and various application fees.
Income £ % Tuition Fees 1,572,599 88% Funding Council Grants 192,084 11% Other Income 16,712 1% Total 1,781,395 100% 
Expenditure
The College recorded spend of £1.76m split between: staff costs, other operating expenses and depreciation. 47% of this spend was incurred on staffing costs, which includes direct staff costs, apprenticeship levy contributions and employer tax, national insurance and pension contributions.
Expenditure £ % Staff Costs 820,426 47% Other Operating Expenses 925,660 52% Depreciation 11,841 1% Total 1,757,927 100% 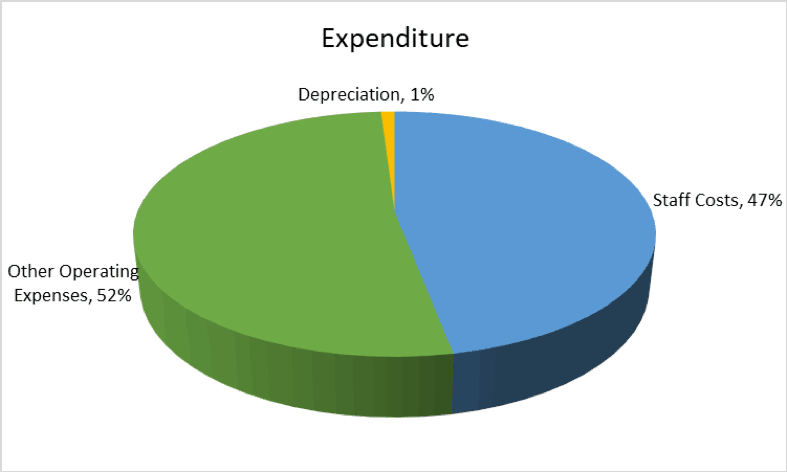
The same £1.76m spend can be shown in different formats to better understand how the College manages its spend. The College regularly reviews its spend and future budget to enable it to make decisions to achieve best value for students.
-
Financial Information 2018-19
This information and the charts below are designed to explain the College’s financial position for the year 01 August 2018 to 31 July 2019 to readers unfamiliar with formal accounts and reports.
The money values have been taken from the published and audited Financial Statements and are presented in a format to provide useful information to students and stakeholders.
The College’s Results for the year 01 August 2018 to 31 July 2019

Income
The College received income of £2.10m in the year ended 31 July 2019. Tuition fees are by far the highest proportion at 90% of income. 9% of income was received in Funding Council grants for the purpose of access and widening participation. 1% other includes income from OCASA activities, transfer and various application fees.
Income £ Tuition Fees 1,899,488 Funding Council Grants 187,480 Other Income 17,883 Total 2,104,851 
Expenditure
The College recorded spend of £1.95m split between: staff costs, other operating expenses, which includes direct course costs and depreciation. 45% of this spend was incurred on staffing costs, which includes direct staff costs, apprenticeship levy contributions and employer tax, national insurance and pension contributions.
Expenditure £ Staff Costs 883,921 Other Operating Expenses 1,057,153 Depreciation 13,075 Total 1,954,149 
The same £1.95m spend can be shown in different formats to better understand how the College manages its spending. The College regularly reviews its spending and future budget to enable it to make decisions and achieve best value for students.
-
Financial Information 2019-20
This information and the charts below are designed to explain the College’s financial position for the year 01 August 2019 to 31 July 2020 to readers unfamiliar with formal accounts and reports.
The money values have been taken from the published and audited Financial Statements and are presented in a format to provide useful information to students and stakeholders.
The College’s Results for the year 01 August 2019 to 31 July 2020.
Income
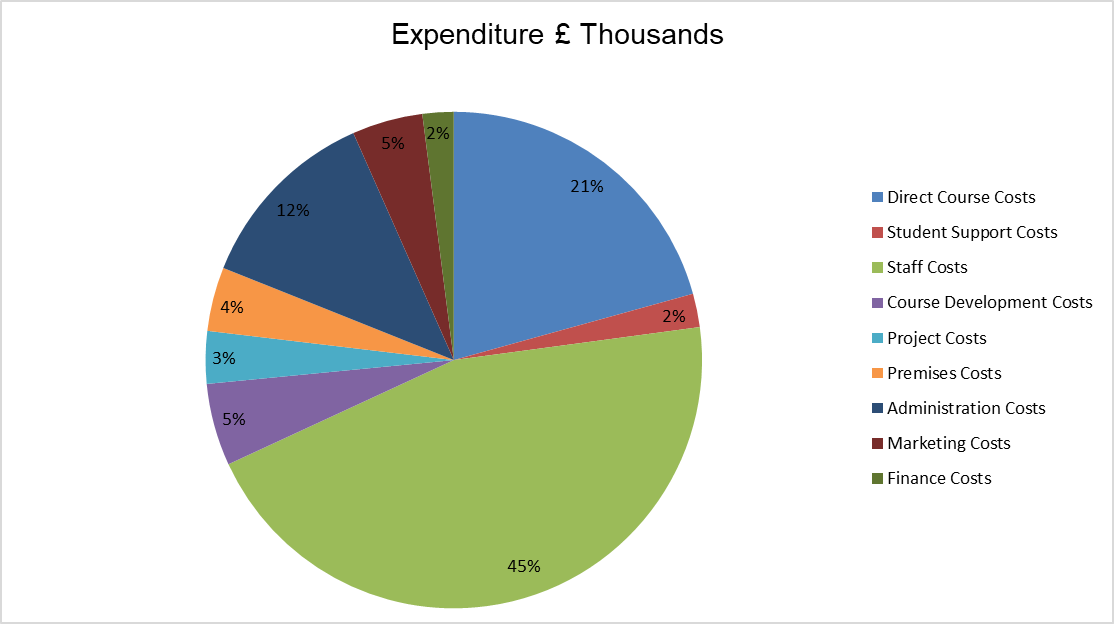
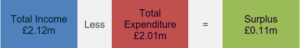
The College received income of £2.12m in the year ended 31 July 2020. Tuition fees are by far the highest proportion at 91% of income. 8% of income was received in Funding Council grants for the purpose of access and widening participation. 1% other includes income from Student Association activities, donations and other fees.
Income £ Tuition Fees 1,928,518 Funding Council Grants 175,314 Other Income 11,936 Donations 10,000 Total 2,125,768 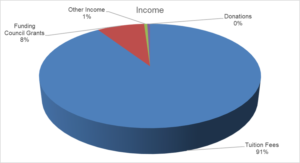
Expenditure
The College recorded spend of £2.01m split between: staff costs, other operating expenses, which includes direct course costs and depreciation. 49% of this spend was incurred on staffing costs, which includes direct staff costs, apprenticeship levy contributions and employer tax, national insurance and pension contributions.
Expenditure £ Staff Costs 991,687 Other Operating Expenses (inc. direct course costs) 1,010,052 Depreciation 13,394 Total 2,015,133 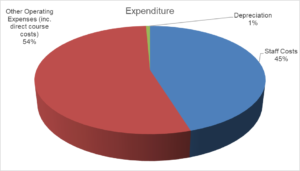
The same £2.01m spend can be shown in different formats to better understand how the College manages its spending. The College regularly reviews its spending and future budget to enable it to make decisions and achieve best value for students.
-
Financial Information 2020-21
This information and the charts below are designed to explain the College’s financial position for the year 01 August 2020 to 31 July 2021 to readers unfamiliar with formal accounts and reports.
The monetary values have been taken from the published and audited Financial Statements and are presented in a format to provide useful information to students and stakeholders.
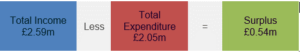
The College’s Results for the year 01 August 2020 to 31 July 2021
Income
The College received income of £2.59m in the year ended 31 July 2021. Tuition fees are by far the highest proportion at 92% of income. 7% of income was received in Funding Council grants for the purpose of access and widening participation. 1% other includes income from Student Association activities, and other fees.
Income £ Tuition Fees 2,392,569 Funding Council Grants 192,663 Other Income 12,384 Total 2,597,616 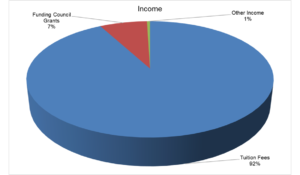
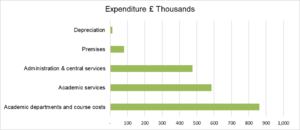
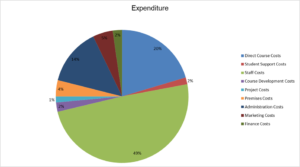
Expenditure
The College recorded spend of £2.01m split between: staff costs, other operating expenses, which includes direct course costs and depreciation. 49% of this spend was incurred on staffing costs, which includes direct staff costs, apprenticeship levy contributions and employer tax, national insurance and pension contributions.
Expenditure £ Staff Costs 1,023,209 Other Operating Expenses (inc. direct course costs) 1,022,761 Depreciation 8,380 Total 2,054,350 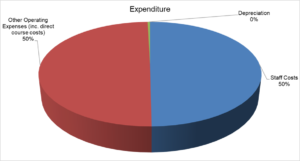
The same £2.05m spend can be shown in different formats to better understand how the College manages its spending. The College regularly reviews its spending and future budget to enable it to make decisions and achieve best value for students.
-
Financial Information 2021-22
This information and the charts below are designed to explain the College’s financial position for the year 01 August 2021 to 31 July 2022 to readers unfamiliar with formal accounts and reports.
The monetary values have been taken from the published and audited Financial Statements and are presented in a format to provide useful information to students and stakeholders.
The College’s Results for the year 01 August 2021 to 31 July 2022

Income
The College received income of £2.62m in the year ended 31 July 2022. Tuition fees make up the highest proportion of income received at 93.6%. 6.1% of income was received in funding grants for the purpose of supporting part time learners, access and widening participation. The remaining 0.2% includes income from Student Association activities, and other fees.
Income £ Tuition Fees 2,451,994 Funding Council Grants 160,321 Other Income 6,036 Total 2,618,351 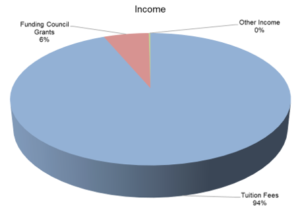
Expenditure
The College recorded spend of £2.47m split between: Staff costs, other operating expenses, which includes direct course costs and depreciation. 75.4% of this spend was incurred on staffing costs, which includes direct staff costs, apprenticeship levy contributions and employer tax, national insurance and pension contributions.
Expenditure £ Staff Costs 1,860,976 Other Operating Expenses (inc. direct course costs) 592,283 Depreciation 14,887 Total 2,468,146 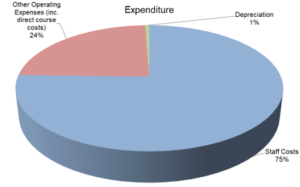
The same £2.47m spend can be shown in different formats to better understand how the College manages its spending. The College regularly reviews its spending and future budget to enable it to make decisions and achieve the best value for students.